
The leadership meeting runs long, the strategy deck is thick, and the same three priorities come back every fortnight. Nobody can say which market pressure is slowing delivery, so the team argues about workload instead of choices. Rivalry gets blamed. A big customer gets blamed. A supplier delay gets blamed. The week ends with more actions and no owner who can show a number.
I sit in those rooms often. The missing piece is rarely another framework. It is a scored view of the market that names the one or two pressures that would change this year's strategy, plus an OKR a named person will review before the month is out.
Why Five Forces Analysis Stalls Before It Drives Action
Picture the offsite. A flipchart holds five boxes. The room agrees rivalry is high and substitutes are a growing worry. Everyone nods. Someone photographs the chart. Three months later those same priorities sit on the agenda, and nobody owns a single action.
A force score is a diagnosis, not a strategy. Porter's Five Forces analysis earns its place only when each force is tied to a decision, a named owner and a measure the team reviews every month. The framework is decades old and still useful. It is often treated as a workshop exercise, then filed. That is why execution stays slow and accountability stays vague.
What follows is practical. You will see the five forces and the question each one asks, a six-step method, how to read UK market evidence without over-trusting it, how buyer and supplier power work, the threats that headcounts miss, and how to turn findings into OKRs. You leave with a scored view of the market, the two forces that matter most this year, and a first OKR for each.
Practical rule: If a force has no owner and no monthly measure, it is a comment, not a priority.
Teams stall here because they treat every box as equal. Five equal priorities means none. I would rather see two forces scored with evidence, and a clear statement of the strategic trade-offs those scores force on the leadership team, than a neat diagram nobody acts on.
The Five Forces and the Question Each One Answers
Score each force from what you measure, not from what feels loudest in the room. A market can look attractive on rivalry and weak on buyer power. That is why the forces must be scored separately. Substitutes are not rivals in disguise. They meet the same need in a different way, such as an in-house team or a software tool.
Competitive rivalry asks how hard existing players fight for the same customers. Threat of new entrants asks how easily a new player can enter and survive. Supplier power asks how much influence suppliers have over price, terms or supply. Buyer power asks how much customers can push on price, scope or terms. Threat of substitutes asks what else could meet the same need, and at what price.
| Force | Core question | What to measure | Signal of high pressure |
|---|---|---|---|
| Competitive rivalry | How hard do existing players fight for the same customers? | Share held by the top firms, price changes, promotional frequency, customers switching | Top firms gaining share, prices falling, margins squeezed |
| Threat of new entrants | How easily can a new player enter and survive? | Capital needed, licences, learning curve, customer acquisition cost, entry and exit rates | Low capital needs and a steady flow of new firms reaching trading scale |
| Supplier power | How much leverage do suppliers have over price, terms or supply? | Number of credible suppliers, switching cost, input share of total cost, scarcity of skills or data | Few suppliers, high switching cost, input critical to the product |
| Buyer power | How much can customers push on price, scope or terms? | Customer concentration, ease of switching, price sensitivity, availability of alternatives | A few large customers, easy switching, standardised offer |
| Threat of substitutes | What else could meet the same need, and at what price? | Alternatives across categories, in-house build options, price-performance gap | Good-enough alternatives gaining share |
A regional firm, scored separately
Take a regional accountancy firm. On rivalry, a national network is bidding the same mid-market clients and cutting fees. On buyer power, three large clients make up a big slice of revenue and compare proposals line by line. On substitutes, freelancers and bookkeeping software cover the routine work those clients used to buy as a bundle.
Those are three different scores. Rivalry might be a 4 because win rates are falling. Buyer power might be a 5 because losing one client would hit the year. Substitutes might be a 3 because software takes the simple work but not the advisory relationship. Averaging them into "competition is tough" hides the decision. The firm needs a price-and-scope response for the large clients, not a generic growth slogan.
Keep this table open. Each later step works through one row: evidence, a score, then an owner.
How to Run the Analysis in Six Steps
A finished analysis is one page: five scores, two priority forces, and owners who can say what they will track and when. Anything longer tends to be a write-up nobody opens again. The diagram below is the working order.
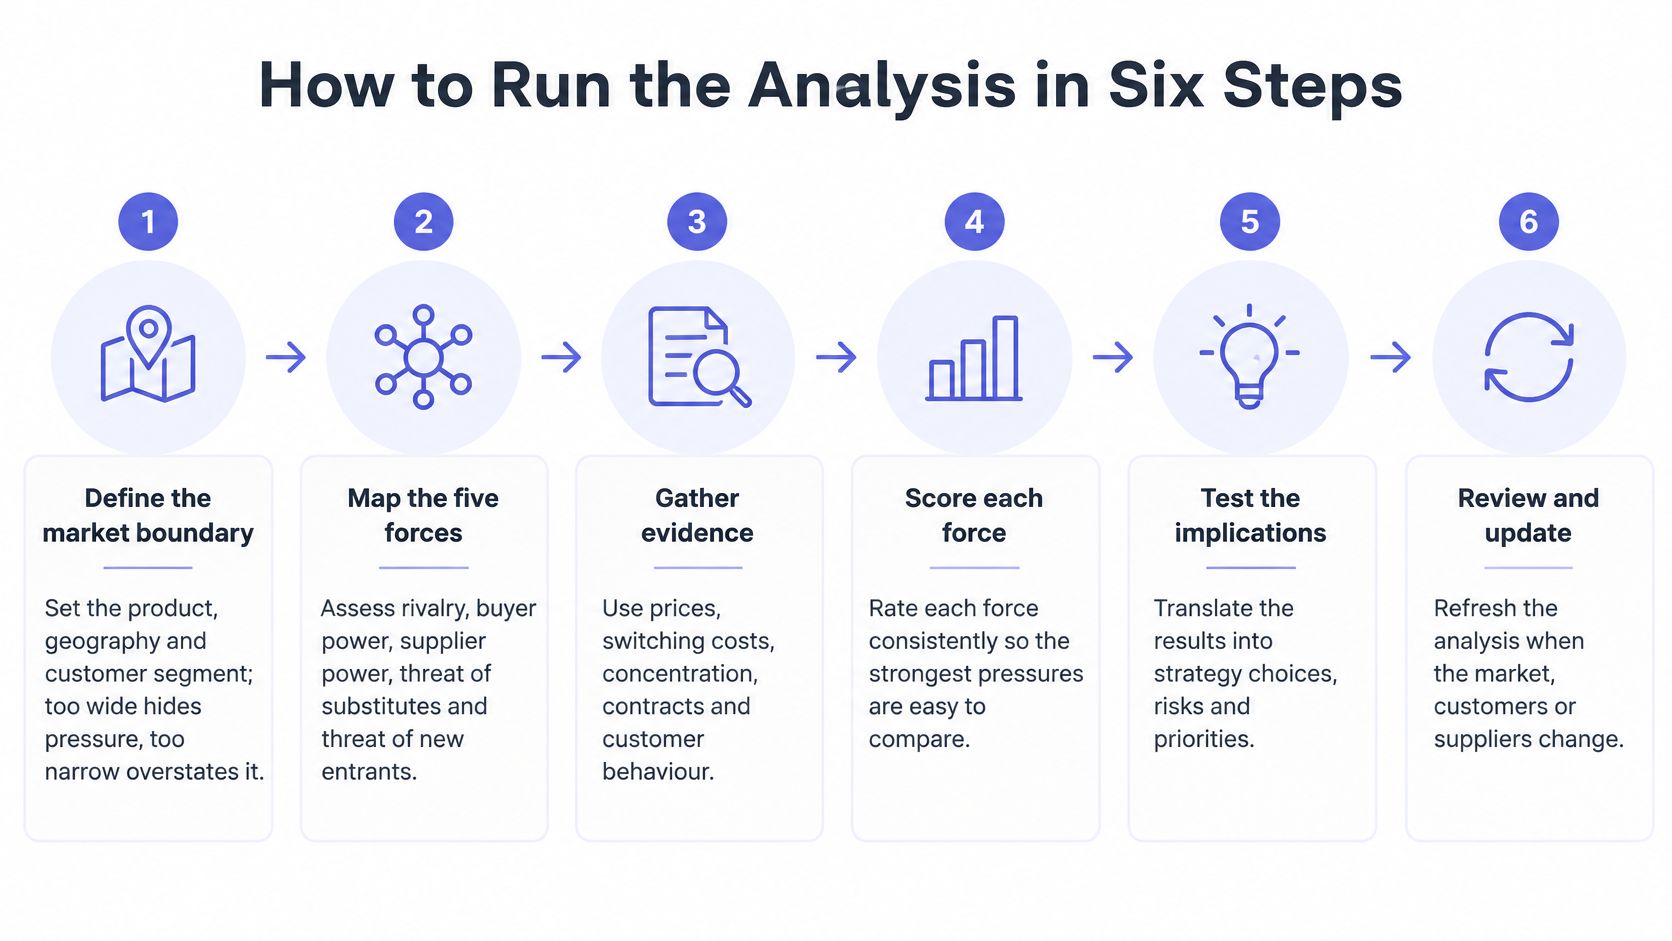
- Define the market boundary. Name the product, the geography (UK only, or UK plus imports) and the customer segment you serve. A boundary drawn too wide hides the pressure; too narrow overstates it. If two parts of the business face different rivals, draw two boundaries and run the exercise twice. The slip is "our industry" with no segment.
- Gather evidence for each force from at least two sources. Market share, pricing history, customer interviews and supplier contract terms all count. One senior person's recollection does not. Date every input, because a share figure from three years ago describes a different force map.
- Score each force from 1 to 5. 1 is low pressure, 5 is high. Write the evidence beside the score, not in a separate pack. Scoring without evidence turns the session into a debate about feelings.
- Weight by effect on margin and growth. Ignore how often a force comes up in meetings. A loud topic can be a small number, and a quiet contract clause can be the thing capping your price.
- Name one or two forces that would change strategy this year. For each, state what you would do differently if it moved a point in either direction. If nobody can answer that, the force is background noise. Naming five priorities means none.
- Assign an owner and a review date. Then carry the priority forces into OKR planning, where a score becomes something a team can move. The discipline is the same one behind keeping client design projects on track: named owners, dated commitments and a review already booked. A force without a diary slot will not survive the next board pack.
Temporary or structural
Mark each force temporary or structural beside the score. Temporary constraints shift as the company grows. Among surveyed mid-market and scaling family businesses, access to markets was the leading growth barrier for 56%, talent and leadership development for 55%, and patient growth finance for 42%, according to the ScaleUp Institute and Family Business UK report. Structural forces, such as buyer switching costs, stay unless you act on them.
Write the label beside the score so this year's fixes sit apart from the pressures you must design around.
The label changes the response. Weak market access for a scale-up is often procurement concentration or weak positioning rather than a generic "high buyer power" score. Talent scarcity shows up as supplier power over specialist people. Tight finance cuts your room to hold price when buyers push. A temporary constraint earns a key result with a deadline. A structural one earns an objective built to work around it.
Measuring Rivalry With UK Concentration Data
A sector with four dominant firms can still bleed margin through discount wars, and a fragmented one can be oddly comfortable. That is why concentration data needs interrogating before it becomes a rivalry score. UK competition analysis uses three measures: the five-firm concentration ratio (C5), the Herfindahl-Hirschman Index (HHI), and the combined share held by the largest firms. Each answers a slightly different question about how crowded the top of the market is.
| Measure | Typical guidepost | What it suggests | Caveat |
|---|---|---|---|
| Five-firm concentration ratio (C5) | 45% or less | Many credible competitors and fragmented rivalry | Ignores imports and new entry |
| Five-firm concentration ratio (C5) | Above 75% | Few firms hold most of the market; watch for pricing power | Concentration alone does not prove high margins |
| Herfindahl-Hirschman Index (HHI) | Above 2,000 | A very concentrated market on the commonly used threshold | Depends on how the market is defined |
| Four-firm share growth | Rise of more than 20% | Competitive pressure may be weakening in that sector | Check whether growth came from mergers or organic gains |
| Average cost markup | Rising trend over time | Greater market power even when concentration is flat | Needs cost data; hard to observe from outside the firm |
Competition analysis of UK industries shows concentration climbed after the 2008 financial crisis and, although it later eased, remained above pre-crisis levels. Most sectors still sit toward the fragmented end of the range, while in a substantial share of industries the largest firms have grown their combined share quickly. Use that as context, then pull the current figures for your own sector before setting the score.
When the count misleads
The CMA's 2024 State of UK Competition report found that average cost markups rose by approximately 9% to 40% in Great Britain over the preceding 25 years, while UK market concentration had not increased over that period. I treat markup movement as the sharper signal. Profit pools can grow and competitive constraints can weaken while the ratio stays flat, and pricing power leaves no trace in a headcount of rivals.
Domestic concentration also overstates power when overseas firms serve UK customers. Define the geographic market and count imports before you lock the score.
Two tests keep the score honest. High concentration with normal margins means rivalry is sharper than the headcount implies, with discipline coming from imports, entry threats or buyer power. Flat concentration with rising markups means power is growing where the count cannot see it, so pull pricing and cost data before you change the score. Stale price files are a common failure. Teams that prevent stale data in pricing dashboards catch a shift in discounting before the quarterly review. Tie those price moves to the metrics and KPIs you already review, and the score stays anchored to numbers finance trusts. Then write it up as a key result: an owned, dated check on concentration and markup data each quarter, so rivalry reaches OKR planning with evidence attached.
Testing Buyer and Supplier Power Through Switching Friction
Counting alternatives on paper is the trap. A buyer may have three suppliers in theory, but little negotiating power if switching takes six months and risks an outage.

The Information Commissioner's Office treats limited alternatives, difficulty comparing providers, switching costs, network effects, economies of scale, data advantages and brand reputation as sources of market power. I score switching friction on four dimensions.
- Contractual exit cost: notice periods, early-termination fees and lost discounts.
- Knowledge-transfer loss: what walks out when the relationship ends.
- Implementation disruption: weeks of rework, retraining and parallel running.
- Outcome-risk exposure: the chance that service, quality or compliance slips during the move.
Say a UK logistics firm runs planning on one cloud provider. Data-transfer fees and a migration measured in months mean the supplier has far more power than a list of cloud brands suggests. The CMA's guidance on market reviews treats costly, complex or risky switching as a source of market power. Technical barriers, egress fees and discount structures make it hard to move or to use more than one supplier. That strengthens supplier power and cuts buyer power, even when alternatives exist on a slide.
What to measure before you negotiate
On the supplier side, check the input's share of total cost, the number of qualified alternatives on file, and how scarce the specialist skill is. Measure switching time in weeks, migration cost as a share of annual contract value, and how many alternatives you have tested.
Could we leave this supplier, or lose this customer, within 90 days without losing a month of revenue?
If the answer is no, the score is high, whatever the brochure count says. That answer is also the brief for the OKR: reduce one dependency, or prove outcomes so a large customer cannot force scope for free.
New Entrants and Substitutes Hiding in Plain Sight
Registering a company is quick, so entry looks easy. Scale is the barrier that matters.
UK government evidence shows that only 47% of the 325,811 start-ups registered in 2020 had survived by 2023, and just 2% of those survivors had reached £1 million in turnover after three years, as set out in the Backing your business evidence annex. Separate legal or technical entry rules from the harder task of building a viable business: funding, learning curves, trusted relationships, operating capability and customer acquisition cost. A market can attract many entrants and still protect firms that already have those assets. The same evidence points to weak access to finance, government support, research-and-development transfers and entrepreneurial education. Score "can they register?" and "can they reach trading scale?" as different questions.
The substitute that never appears on a competitor list
A long-standing client starts building an internal tool with AI. Your renewal price comes under pressure before anyone has named a competitor. That is a substitute. AI can cut the cost of building a product or delivering a service, and it can make a rival's offer catch up faster. Among surveyed UK firms, 60% want increased use of AI to support growth, while 67% prioritise better access to skilled employees, according to the British Chambers of Commerce growth report. Write down the force AI changes first, then the execution change that follows. Often the first change is substitutes, because a client can build a good-enough version. The execution change is shorter cycle time and a clearer point of difference, not a slide that says "we use AI".
List every substitute: an in-house build, a software tool, an offshore provider, and doing nothing. Then ask which entrant or substitute would hurt your margin within 12 months. Political and regulatory shifts can change that list quickly, which is why a PEST analysis of political factors belongs next to the entrant score, not in a separate binder.
Turning Each Force Into an OKR Priority
Do not write five OKRs, one for each force. Pick the one or two forces that would change your strategy this year. Write one objective per priority. An objective describes an outcome, not the force. "Reduce rivalry" is a diagnosis. "Win more head-to-head deals on our point of difference" is an objective.
Use two or three key results. Each needs a baseline from your own data, a target and a date. Then test the objective against the three strategic choices in the Playing to Win framework: Where to Play, How to Win and Capability Focus. If an OKR fits none of them, it is probably activity rather than strategy. A useful way to see that test fail is to turn reports into compelling executive summaries: if the one-page summary cannot state the choice, the OKR is a task list.
| Force | Strategic priority | Example key result | Leading indicator |
|---|---|---|---|
| Competitive rivalry | Compete on a clear point of difference | Lift win rate in the target segment from baseline to target by Q4 | Win rate by segment; discount depth |
| Threat of new entrants | Make the offer harder to copy quickly | Two proprietary service modules, each used by ten clients by year end | Client adoption rate; time to first value |
| Supplier power | Reduce dependence on any single critical supplier | No single supplier above 30% of critical spend by Q3 | Top-supplier share of spend; qualified alternatives on file |
| Buyer power | Protect price and scope with proven outcomes | Cut average discount to list price from baseline to agreed target by Q4 | Renewal rate; discount to list price |
| Threat of substitutes | Stay ahead of in-house and software alternatives | Two client-facing automations cut delivery cycle time by 20% | Cycle time; share of work delivered through automation |
How a monthly check stays honest
Add a leading indicator to each key result, such as win rate by segment or time to first value, so you see movement before the lagging result lands. The owner reviews that indicator each month, decides whether the priority still holds, and reports one decision made because of the data. "We discussed it" is not a decision. Changing a discount rule, dropping a segment, or qualifying a second supplier is.
I use a simple filter with leadership teams. If the key result can be hit by working harder on the same offer, it will not move the force. The 4 Action Framework helps here: raise what buyers will pay for, reduce what they ignore, eliminate work that feeds a weak force, and create the capability the priority needs. Misalignment shows up when sales owns the win-rate result and delivery owns none of the cycle time. Put both names on the OKR, or the review will split into two stories.
Pick One Force and Set Its OKR This Quarter
Choose the single force that would change your strategy most this quarter, name one owner, and agree the baseline and review date before the meeting ends.

Check readiness before you write key results.
- Authority: the owner can act on the force, not just report it.
- Evidence: one source per force, dated and written down.
- Baseline: from your own data, not from memory.
- Leading indicator: already being captured, not just planned.
- Review slot: a monthly meeting in the diary for the next three months.
If one of these is missing, the quarter's OKR is a wish, not a plan. Readiness is not a formality. If I think an organisation is not ready for OKRs, I will say so and explain why. A free OKR Maturity Assessment takes 10 minutes and scores an organisation across five dimensions of OKR maturity. Use that, or a blunt conversation, before you load another objective onto a team that cannot hold priorities. Prioritising with OKRs only works when the list is short enough that a missed result is visible.
I help leadership teams turn strategy into consistent delivery, choosing priorities, setting OKRs that measure real change and building the routines that keep them honest each quarter. book a conversation